
Ian Roback
Natural Resources and Sustainable Development Student, School of International Service
Abstract
Nitrogen pollution causes environmental, economic, and human health damages mostly due to agriculture fertilizer runoff based on government monitoring. Spatial models for nitrogen pollution have been created by hydrologists and economists to form hydrologic-economic models (tools to analyze costs and benefits of water quality in rivers and drinking water) at regional and field scales that determine the optimal spending to reduce social costs. Economists argue for a combination of the two scales to achieve the highest pollution reduction because targeting a highly polluted region will reduce total pollution, and targeting highly polluted fields in these areas will achieve the most reduction per field.
Minnesota’s Nitrogen Policy focuses specifically on regional scales because the focus is on reducing total pollution. However, if we can reduce pollution at a higher rate on the same number of fields by targeting more polluted fields, then total pollution will be reduced more by the field-scale model. This approach can reduce pollution at a much higher rate for the same price, saving ecosystems and water-dependent economies, so I tested the two models against each other. I use regional outputs from the SPAtially Referenced Regression On Watershed attributes (SPARROW) geodatabase and field-scale outputs from the Agriculture Conservation Practice Framework (ACPF) geodatabase to test if there is a significant increase in the Nitrogen (N) reduction rate per field in the field-scale model. Using the ACPF, I conducted a benefit/cost analysis with N reduction as the benefit and the cost in dollars for the solutions used to reduce nutrients by that much. I find that the field-scale model can significantly increase N reduction / dollar cost compared to the regional model by targeting fields with high runoff risk. However, in the test watershed, the field-scale model reduces total N in the watershed to a lesser degree than regional targeting because fewer fields are selected for best management practices. Policymakers and businesses who begin using field-scale targeting models to implement Best Management Practices (BMPs) should consider if there will be a significant increase in N reduction / dollar cost by individual watersheds because some watersheds may benefit more from field-scale targeting than others based on number of fields with high runoff risk.
Introduction: history and premise of economic arguments for best management practice site targeting
Nitrogen pollution poses an existential threat to fish and wildlife and economic risks to US drinking water and recreation. Ten percent of US recreational fishing is directly impaired every year due to excess agricultural nutrients sourced into the Mississippi River by tributaries in the Midwest (Petrolia & Gowda). Nutrient pollution directly damages the economy upstream as coldwater wildlife is unable to live in eutrophic (excess nutrients and algal growth) rivers and lakes near the farms (Jacobson et al.). Two techniques that Midwest states use to reduce pollution include targeted practices on fields with the largest incremental pollution and non-target practices that apply a strategy to an entire catchment (landscape where all water pools together), watersheds (larger basins and catchments), or state.
In attempting to design better pollution reduction, economists developed large regional models to cover broad non-targeted areas on all available land. The works of Rabotyagov et al. (2010) sought to reduce nutrient pollution on a massive scale, configuring various best management practices along the Mississippi River and its tributaries and then configuring them into two options. The first option reduced phosphorus runoff at higher rates but increased nitrate runoff. They recommend the second option which uses grassland wetlands, fertilizer reduction, and land retirement together as the most cost-effective strategy (Rabotyagov et al.). While this strategy is only able to reduce 30 percent of nitrate, a combination of this regional strategy and a field-scale strategy could produce the most substantial abatement of nearly 40 percent.
To target areas causing the most damage while keeping costs low, economists must redesign the targeting system which uses wetland restoration and land retirement (returning farmland to the natural ecosystem including buffer zones between farms and streams)."
Ian Roback
Natural Resources and Sustainable Development Student, School of International Service
Economists typically use wetlands and land retirement because they have low capital costs with high benefits. Several economists designed studies on wetlands and buffer zone differences. Jones et al. assert in their article that previous works focused on wetland systems because they are more effective at higher altitude systems (Jones et al.). Targeting high-altitude regions becomes a clear economic goal. However, as seen in large mapping systems, wetlands react to field-scale soils and nutrient loads varying their efficacy across the landscape. To account for field scale parameters, models must target the highest-polluted watersheds, catchments, and fields.
Policy analysis: Minnesota catchment and nitrogen policy goals and fit with current SPARROW targeting model
Minnesota nitrogen policy
Minnesota’s catchment and Nitrogen pollution policy is managed by the Minnesota Pollution Control Agency (MPCA). Minnesota’s current estimate for Nitrogen pollution comes from 5 separate approaches, which include four regional modeling and analysis approaches and a literature review approach. These approaches form the basis for Minnesota policy, but they do not include a field-scale approach to determine which fields have the highest pollution. Nevertheless, there are improvements that can be made even at the regional scale as I explain below.
The SPARROW model
To analyze the effectiveness of the SPARROW model, I compared MPCA objectives in their published “Nitrogen in Minnesota Surface Waters” policy and the data restrictions for SPARROW modeling documented by Robertson and Saad (Robertson & Saad).
According to Robertson and Saad, a “primary assumption” in the SPARROW model was that the “quantity and quality of the explanatory and calibration data” were adequate to create an accurate model. If this assumption is incorrect, the results will be invalid, and new data will need to be used.
The SPARROW model had the geographic limitation of not being able to account for all sources of nutrients or all “landscape properties” of the modeled area because of data availability. This was especially evident in the western regions of the study area. There are also limitations in the accuracy of the input data.
The SPARROW model and study by Robertson and Saad included spatially varying land-to-water delivery variables to better describe different land practices and environmental interactions. However, relatively large residuals were still identified in the western part of the study area. Larger residuals create a larger standard error in the model, so this can be concerning if the residuals increase in other areas.
Other researchers have tried to overcome spatial problems by developing separate, smaller-scale SPARROW models for different areas of the Midwest. Robertson and Saad found that this approach results in a “limited number of calibration sites and a smaller range in environmental conditions” that make the model calibration difficult. The catchments in the SPARROW models were about two square kilometers, but much of the source data and landscape data used to describe variability in “land-to-water delivery” came from county-wide averages or totals. The use of county data makes the sparrow model’s catchment units limited in describing the highest incremental yield. This data limitation lessens the model's ability to accurately target the catchment and below the catchment.
In addition, Robertson and Saad find that 95 percent of the sites used to calibrate the SPARROW models were located on streams with drainage areas of more than 31 square kilometers, approximately 7660 acres, and may not represent the smallest streams in the Midwest. Therefore, it is difficult to know how well the model predicted loads in drainage areas smaller than 31 km2. The field-scale model can fill this gap.
Robertson and Saad conclude that “fine scale landscape data and monitoring data” on small streams needs to be taken to interpret the catchment results that are output from the SPARROW models. They urge caution when using the fine-scale results. This gap in SPARROW’s performance can be filled by either increased monitoring or the addition of a field-scale hydrologic model that can account for small streams.
The Hydrological Simulation Program-Fortran (HSPF) model
The other model used by the MPCA for regional modeling is HSPF. I analyzed the HSPF model similarly by comparing MPCA objectives and data limits documentation from the EPA in 2015 to determine if this model is worth further investigation compared to SPARROW (Crossette et al., n.d.). Crossette et al. note that the data limitation for the HSPF model is the “accuracy and resolution” of input data from county sources. Users also require significant training and modeling skills in order to use HSPF. Additionally, the EPA website linked in the documentation from Crossette et al. states that the HSPF model is used in combination with other models as an input to the Better Assessment Science Integrating Point and Non-point Sources BASINS model. The HSPF model used in the Minnesota Nitrogen Policy will not be a primary focus in this paper because it is an input to the larger BASINS model that has similar applications to SPARROW.
Minnesota Nitrogen Policy has the goal of reaching a 30 percent reduction of nitrogen from streams."
Ian Roback
Natural Resources and Sustainable Development Student, School of International Service
Data Requirements for Minnesota Policy
The current MPCA model seeks to reduce nutrient pollution by implementing conservation practices on 100 percent of qualifying land. The MPCA has found that available conservation practices will not be enough to reduce pollution to the target of 30 percent. The gap in data according to the MPCA comes from a lack of practices that can be applied to more qualifying land with a higher reduction rate. The MPCA is prioritizing tile-drained land in Southern Minnesota. While the MPCA studies have focused on 100 percent of qualifying land to make their estimates, the Nitrogen Policy argues that cumulative smaller-scale changes such as conservation Best Management Practices (BMPs) repeated in the most polluted watersheds will make an “appreciable difference” in nitrogen loading. This suggests that watershed, catchment, and field-scale targeting could lead to a similar result in nitrogen removal if the focus is on agriculture pollution in the MPCA-identified “top 10-20 loading” watersheds.
Economic Analysis: Comparing Field-Scale and Watershed-Scale Hydro-Economic Modeling
Data retrieval with the SPARROW model
Desired catchments and HUC eight watershed for use in an economic model were obtained from the SPARROW midwest mapper. The area of interest was narrowed down to: 1) the states of Minnesota 2) the major drainage area of the Mississippi 3) HUC eight watersheds south of Ramsey County and east of Watonwan County. I performed an ANalysis Of VAriance ANOVA test on the data to find statistically significant incremental N loads in catchments across the selected HUC eight watersheds. The catchments with statistically higher incremental N loads were selected for further modeling at the field scale and recommended as target watersheds at the regional scale.
Field-scale modeling is used to display pollution outputs by hydrology and agriculture inputs such as surface runoff, stream flow, tile flow, plant growth, erosion, sediments, nutrients, and pesticides documented by Wang et al. using the Agricultural Policy / Environmental eXtender APEX model(Wang et al.). The field-scale reveals which agriculture operations produce the highest N yield to catchments polluting HUC eight in the Mississippi River basin. I compare the costs for the field-scale targeting model with the regional-scale model currently used by the MPCA to reduce nutrient loads. The cost for the field-scale targeting model is calculated using the Agriculture Conservation Practice Framework-Financial and Nutrient Reduction Tool (ACPF-FiNRT) for the regional model, with agriculture fields that are high risk for runoff selected rather than 100 percent of suitable acres. The total cost for the field targeting model is stratified to each BMP used. I chose the contour buffer strip BMP for analysis and multiplied the average hectares of the buffer strip by the number of buffer strips used in the regional and field-scale models to get the total hectares of each model and multiplied the total hectares by the cost of buffer strips to find the difference. I also tested the nitrogen reduction between field-scale and the catchment.
I then compared the N reduction in the two models using a T-test to test for statistically significant differences between the MPCA regional model vs. the field model. The N reduction per field is calculated as a weighted average N reduction. The weighted N reduction is the value of the N reduction by BMP multiplied by the level of risk on a scale from zero to three with zero as the lowest risk and three as the highest risk. Practical significance is determined by the difference in dollar cost and the difference in N reduction and is up to the discretion of policymakers and technical service providers.
Data: SPARROW model outputs and field-scale model outputs
Minnesota nitrogen policy
The MPCA is the state body that creates the nitrogen pollution policy. Data from the MPCA’s Nitrogen in Minnesota Surface Waters document is collected for conservation Best Management Practices (BMPs) N reduction to waters if adopted statewide (MN) on 100 percent of suitable acres. The document states that “Meaningful N reductions to surface waters at regional scales cannot be achieved by solely targeting small ‘hot spots’ based on geologically sensitive areas or by targeting ‘bad actors.’” This stance against a field-scale model, and the use of the SPARROW regional model, demonstrates that the Minnesota Nitrogen policy is focused on regional targeting. There is no other mention of field-scale models in the document beyond monitoring data collected in-field that is added to SPARROW.
Minnesota Target Catchments and Sites
The target Catchments identified by the Minnesota Nitrogen Policy were all catchments within the top 10-20 N polluting watersheds. Watersheds identified with the highest N loading were in Southern and South-Eastern Minnesota, including the Le Sueur River, Cannon River, Zumbro River, Cedar River, Lower Minnesota River, Minnesota River Mankato, Watonwan River, and Blue Earth River watersheds. The Zumbro and Cannon rivers are the highest polluting Lower Mississippi Basin watersheds.
HUC 8 watersheds data
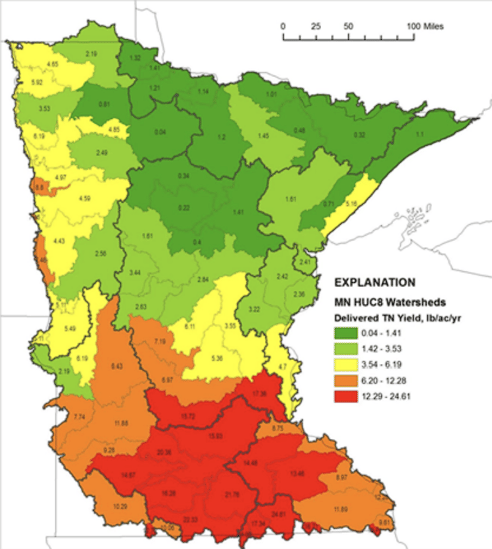
Due to the Minnesota Pollution Control Agency’s priority in Southern Minnesota, and the identification of the watersheds with Total Nitrogen above 12.29 lbs/acre/yr, I analyzed catchments in the Le Sueur River, Cannon River, and Zumbro River watersheds using SPARROW. The most polluted HUC 12 catchments from fertilizer pollution in these watersheds were Catchment Number MN_10597174 Boot Creek: Le Sueur Watershed, Catchment Number MN_2034505 Straight River: Cannon Watershed, and Catchment Number MN_2443144 Middle Fork Zumbro River: Zumbro River. I ran an ANOVA test on the SPARROW catchment data to determine all other catchments with N pollution from farm fertilizer pollution significantly above average. This showed the catchments with the most significant pollution to prioritize on a regional scale.
Field-Scale Model Target Sites
I identified field-scale target sites by analyzing field-scale data from an HUC 12 watershed containing the highest polluted catchment in the SPARROW model, Boot Creek: Le Sueur Watershed. To do this, I used the Agriculture Conservation Planning Framework’s Financial Nutrient Reduction Tool(beta) ACPF developed by the University of Iowa. I analyzed the total cost to implement these best management practices using data from the Minnesota Nitrogen BMP tool as well as documentation for the Financial Nutrient Reduction Tool (FiNRT).
The Boot Creek River HUC 12 Watershed in the FiNRT field model consists of 58.526165 kilometers of buffers. The inputs into ACPF showed that using a regional model for the watershed with 100 percent qualifying land implemented, the HUC 12 watershed will incur annual costs for 260 hectares of contour buffer strips at $18,717.75. Total pollution within the watershed is 151,709.4774 kilograms. The watershed is made up of 387 agricultural fields.
The highest polluting catchment, Boot Creek, comprises 117 fields and has almost half the pollution of all 7 catchments by incremental yield. As a metric of N reduction between the regional and field-scale model, I create a weighted reduction by taking the percentage reduced from each BMP multiplied by the “ runoff risk” variable in the dataset, assigned values 0,1,2,3 to the values “present”, “high”, “very high”, and “critical” respectively, and averaged the total across all fields with BMPs.
To illustrate this concept, I used the buffer strip BMP. The weighted average of N reduction using 100 percent of qualifying fields in the catchment with regional targeting was 1.141636364. The weighted average for N reduction using targeted fields in the catchment was 1.531463415. The weighted average for N reduction in targeted fields was calculated by removing all buffers on fields with values of “present” (zero) runoff risk from the tested fields. A higher weighted average for N reduction in targeted fields demonstrated that N reduced per field was higher with field targeting compared to regional targeting.
Results: Economics and Nitrogen Reduction Compared Between Both Models
ANOVA Test on SPARROW Catchments Result
The ANOVA test revealed that there is a significant difference in pollution between the three watersheds and the Le Sueur Watershed had the largest average N pollution from farm fertilizer. After filtering the data to the highest polluted catchments in Minnesota (incremental yields above 3240 kg N), the Zumbro River Watershed’s catchments had a mean of 5382.216 kg N and a standard deviation (SD) of 2931.5578 kg N. The Le Sueur Watershed’s catchments had a mean of 10346.0727kg and a SD of 9364.9074. The Cannon River Watershed’s Catchments had a mean of 7193.3537 kg and a SD of 5203.6416. Using the mean and SD, I calculated the Z-score to find observed variables with a Z-score above 1.65 which resulted in a p-value below 0.05 showing statistical significance. Catchments with a p-value below 0.05 were considered significantly more polluted than the average catchment identified by the SPARROW model. These showed the significantly polluted catchments within each watershed demonstrate where policymakers can choose to prioritize subwatershed abatement policy (see Figure 1 in the appendix for a list of the significantly polluted catchments by watershed).
The significantly polluted catchments in each of these watersheds are at least nine subwatershed areas within each watershed which policymakers can prioritize within Southern Minnesota if they choose to continue regional targeting."
Ian Roback
Natural Resources and Sustainable Development Student, School of International Service
Cost Comparison and Nitrogen Reduction Results
The cost for 100 percent of the entire catchment using the buffer strip BMP was approximately $5121.77 and the cost for the targeted approach using only fields with high, very high, and critical runoff risk was approximately $3818.05. These numbers were calculated by assuming that the practice was a contour buffer strip on each selected field. This showed a cost saving of $1,300 in this catchment alone. Considering there are seven catchments within this HUC12 watershed, and I identified 35 significantly polluted HUC12 watersheds the savings could be in the ballpark of $350,000 for this conservation practice alone.
The Nitrogen reduction comparison statistical test was between the buffer strip data in the watershed at the regional and field-scale values. As stated, the N reduction for regional and field-scale targeting methods were 1.14164 and 1.53146 respectively showing that field-scale targeting resulted in higher N reduction. The T-test resulted in a P-value of .00251, showing that there is a statistically significant difference in the weighted N-reduction between the regional and field-scale targeted models—confirming that the field-scale will have higher N reduction per field across the catchment. With significantly higher results in field-scale targeting, we know that prioritizing only high, very high, and critical runoff fields for buffer strips results in significantly higher N reduction per field in the catchment. If the same amount of fields were selected in each model, the total N reduction for the catchment is higher using the field-scale model.
Conclusion: A Shift in Modeling
The results demonstrated that there was a significantly higher proportion of nutrients reduced from more heavily polluting fields using the field-scale targeting model versus the regional targeting model. Additionally, the field-scale model was lower cost than the regional model. Knowing that the weighted average for N reduction is higher at a lower cost with the field-scale model, I conclude that the field-scale model has a higher percent N reduction / dollar cost than the regional model.
If farmers' participation remains the same between field scale and regional targeting, the field scale will reduce pollution at a higher rate for the same cost or at the same rate for a lower cost. There is an opportunity to raise incentives for farmer enrollment in BMP programs with the money saved by using the field-scale model. I recommend further consideration on raising farmer buy-in incentives if policymakers use the field-scale targeting model.
If the limiting factor on adding BMPs is farmer participation in programs, there may be an increase in enrollment if farmers with highly polluted fields are compensated more. The demand for conservation practices will increase with higher incentive payments and total reduction will decrease until conservation planners reach market equilibrium at a level where farmer participation has increased and total reduction has increased. Overall, the field-scale targeting model can be a cost-effective tool for N reduction. Policy-makers and businesses using field-scale targeting should consider if the goal is total N reduction or the highest rate of N reduction in areas where BMPs are installed. Further research on incentive rate increases after implementing field-scale targeting will help determine how many farmers will view conservation practices as an asset for diversified income.
Appendix
Figure 1: Significantly Polluted Catchments by Watershed
| Zumbro River | Le Sueur River | Cannon River |
| MN_2441804 | MN_10597174-Boot Creek | MN_2034505-Straight River |
| MN_2443144-Middle Fork Zumbro River | MN_10597210 | MN_2034415 |
| MN_2443712 | MN_10596160-LeSueur River | MN_2033649 |
| MN_2443138 | MN_10597196 | MN_2033689 |
| MN_2444514 | MN_10597150 | MN_2033647-Mud Creek |
| MN_2440798-North Branch Middle Fork Zumbro River | MN_10596964 | MN_2033345-Straight River |
| MN_2443684 | MN_10597468 | MN_2034497 |
| MN_2440920 | MN_10597146 | MN_2033905 |
| MN_2443040 | MN_10597470-Rice Creek | MN_2033695 |
| MN_10596988-Le Sueur River | MN_2033207 | |
| MN_10597120-Little Cobb River | ||
| MN_10597152 | ||
| MN_10597466 | ||
| MN_10597192 | ||
| MN_10596936 | ||
| MN_10596890-Little Cobb River | ||
| MN_10596850-Boot Creek |
Citations
Crossette, Emily, et al. APPLICATION OF BASINS/HSPF TO DATA-SCARCE WATERSHEDS. p. 88.
Executive Summary Nitrogen in Minnesota Surface Waters. p. 24.
- Å imunek, et al. “HYDRUS: Model Use, Calibration, and Validation.” Transactions of the ASABE, vol. 55, no. 4, 2012, pp. 1263–76. DOI.org (Crossref), https://doi.org/10.13031/2013.42239.
Jacobson, Peter C., et al. “Coldwater Fish Oxythermal Habitat in Minnesota Lakes: Influence of Total Phosphorus, July Air Temperature, and Relative Depth.” Canadian Journal of Fisheries and Aquatic Sciences, vol. 67, no. 12, 12, 2010, pp. 2002–13. bridge.primo.exlibrisgroup.com, https://doi.org/10.1139/F10-115.
Jones, Carol Adaire, et al. “New Uses of Old Tools? Greenhouse Gas Mitigation with Agriculture Sector Policies.” Applied Economic Perspectives and Policy, vol. 35, no. 3, 3, 2013, pp. 398–434.
Petrolia, Daniel R., and Prasanna H. Gowda. “Missing the Boat: Midwest Farm Drainage and Gulf of Mexico Hypoxia.” Review of Agricultural Economics, vol. 28, no. 2, 2, 2006, pp. 240–53.
Rabotyagov, Sergey, et al. “Least-Cost Control of Agricultural Nutrient Contributions to the Gulf of Mexico Hypoxic Zone.” Ecological Applications, vol. 20, no. 6, 6, 2010, pp. 1542–55. Wiley Online Library, https://doi.org/10.1890/08-0680.1.
Robertson, Dale M., and David A. Saad. “Spatially Referenced Models of Streamflow and Nitrogen, Phosphorus, and Suspended-Sediment Loads in Streams of the Midwestern United States.” Scientific Investigations Report, 2019–5114, U.S. Geological Survey, 2019. pubs.er.usgs.gov, https://doi.org/10.3133/sir20195114.
Wang, Xiuying (Susan), et al. “EPIC and APEX: Model Use, Calibration and Validation.” Transactions of the ASABE (American Society of Agricultural and Biological Engineers), vol. 55, July 2012, pp. 1447–62. ResearchGate, https://doi.org/10.13031/2013.42253.